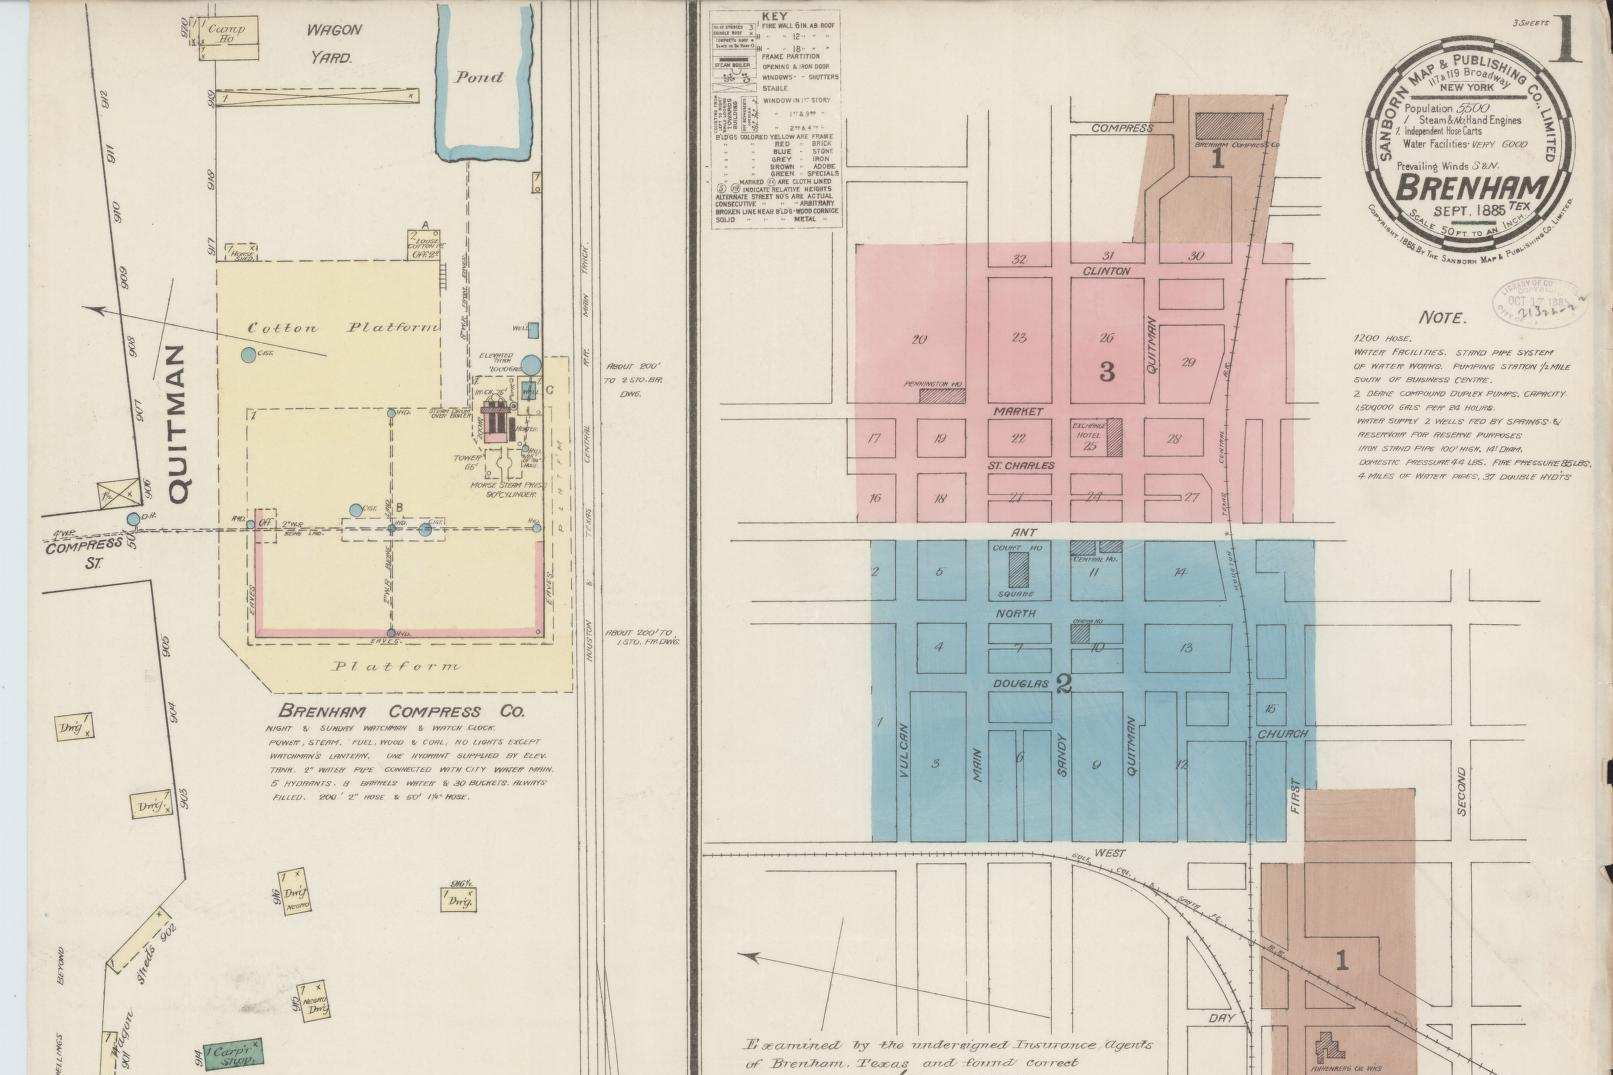
The sheet on my table is the first of three that make up the Sanborn fire insurance map of Brenham, dated September 1885 and now in the Library of Congress.1 I print it large, because the most interesting things on it are small. A round seal in the upper corner gives the town’s population as 5,500, the water facilities as very good and the prevailing winds as south and north, at a scale of fifty feet to an inch. A copyright stamp beside it is dated October 17, 1885. A note lists a stand pipe a hundred feet high, pumps rated at 1,500,000 gallons a day, four miles of water pipe and thirty seven double hydrants.2
Half the sheet is given to two businesses. The Brenham Compress Company has a cotton platform the size of several town blocks, with a night and Sunday watchman and a watch clock, hydrants in the yard and barrels of water kept always filled. Ahrenbeck Oil Works, across the tracks, runs night and day.2 The courthouse, by contrast, is a small hatched rectangle labeled Court Ho in the middle of the square. And in the blank space near the center, in a careful hand, two local insurance agents have signed a statement that they examined the map and found it correct.2
That signature is the key to the whole record. The Library of Congress puts the point plainly: these maps were made for a very specific use, and the insurance industry dictated what was mapped and how it was shown.3 The agents were not certifying Brenham. They were certifying the risks they wrote policies on. The compress gets a page of detail because it could burn and take a fortune with it. The courthouse gets a label.
Most researchers come to Sanborn maps for the buildings, and the buildings are extraordinary. Color gives the material, pink for brick, yellow for frame. Numerals give the number of stories, letters mark a dwelling or a store or a saloon, and line styles show fire walls and openings.3 Most sheets were drawn at one inch to fifty feet.3 I use all of that. What I want to argue about is the other way these maps get used, the way the title of this essay invites: laying a run of editions side by side to date a town’s growth.
Here is the Brenham run as the Library of Congress holds it. The 1885 edition has three sheets. The 1891 edition has five, 1896 six, December 1901 seven, July 1906 ten, October 1912 fourteen, August 1920 sixteen, January 1931 twenty two, and an edition dated 1931 to 1947 has twenty three.4 On its face that is a town growing fast, sheet by sheet, for half a century.
Now set the census beside it. The Handbook’s population figures for Brenham read 4,101 in 1880, 5,209 in 1890, 5,968 in 1900, 4,718 in 1910 and 5,066 in 1920.5 Between 1901 and 1912 the map doubled, from seven sheets to fourteen. Over roughly the same years the town lost about a fifth of its people. The seal’s own figure of 5,500 in 1885 sits well above the census on either side of it, which I take to be an estimate the surveyor was given rather than a count.
So the sheets date something, but not the town. They date the growth of what the company and its customers wanted drawn. More sheets can mean more ground surveyed, more detail on the same ground, a new industrial plant at the edge worth a sheet of its own, or a policy shift at the company. The Library of Congress notes that each edition’s key map shows the portions of a town that were mapped, and that scales were reduced for suburban areas and large industrial sites.3 The extent of a Sanborn edition is a fact about coverage. Treating it as a measure of population or prosperity puts an insurer’s business decisions into the place of a town’s history.
That is the position I would take against a good many people who use these maps well. I never use the number of sheets, or the mapped area, as evidence that a town grew, and I never read a block that is missing from an edition as a block that was empty. An experienced map historian would object that coverage broadly tracked development, since Sanborn surveyed where there were buildings worth insuring, and that for most towns the two lines rise together. Often they do. Brenham between 1901 and 1912 is my reason for not assuming it.
What a single sheet does prove is narrower and very strong. On the date of survey, a building of this footprint, this material and this height stood on this lot, used for this purpose, with these hydrants and this water pressure nearby, as seen by someone paid to be accurate about fire. Dating is its own trap. The Library of Congress explains that from around 1920 the company kept maps current with paste on correction slips, sometimes fifty or sixty series of them over thirty or forty years, so that a sheet with one date printed on it can hold changes from many later years.3 The Brenham edition catalogued as 1931 to 1947 looks like that kind of object, since the Library dates such editions by the original printing and the latest correction.43 Before 1920 the problem is smaller, and small town editions usually carry the month and year of publication on each sheet.3 The 1885 sheet does.
What a sheet leaves off is the rest of the town. Along the left margin of the 1885 sheet a note records frame dwellings beyond the drawn area, and the map simply stops there.2 Anyone who lived past the edge of an insurer’s interest is absent, and who those people were is a question the sheet was never built to answer. The map names a business where the name mattered to the risk, and it names no residents at all. It records what a building might cost an insurer.
A county courthouse shows the gap from the other side. A civic building like the one in the entry on Old Red matters to a town’s history far beyond its value as a fire risk, and on an insurance sheet it may receive less attention than a cotton platform. For the county’s own story the commissioners’ minutes and the newspaper are better witnesses. For the question of what burned easily and what did not, the map is the best witness there is.
The Portal to Texas History holds a large Texas set, 11,480 items contributed by the Briscoe Center for American History, most of them from the 1880s to the 1920s, which is the same window in which the Brenham run is richest.6 Its holdings are described in the reference entry on the Portal. The printed advertisements of the same towns record a different slice of the same commercial life, taken up in the next essay, on the paid columns of a newspaper, and a Sanborn lot is often where an arrival from the Galveston lists can finally be placed. I read these sheets with the habits of someone who has spent most of a working life in energy finance, described on the about page, where an underwriter’s view of a property is a document to be read for its purpose. The method of joining one place across several records is the one used in the three sources on a single delegate, and the remaining record studies sit on the archives landing page.
When I first wrote about a Texas town from its insurance maps, I made a choice that slowed the writing: I drew the edge of the surveyed area on my working copy of every sheet and refused to say anything about the town beyond it on the strength of the map. It cost me a tidy paragraph about growth. Handed the same sheets tomorrow, I would draw the same line.
References
-
Library of Congress, Geography and Map Division, Sanborn Fire Insurance Map from Brenham, Washington County, Texas, September 1885. ↩
-
Sanborn Map and Publishing Company, Brenham, Texas, sheet 1, September 1885, Library of Congress, digitized sheet. ↩ ↩2 ↩3 ↩4
-
Library of Congress, Sanborn Maps, About this Collection. ↩ ↩2 ↩3 ↩4 ↩5 ↩6 ↩7
-
Library of Congress, Sanborn Maps collection, search results for Brenham, nine editions, 1885 to 1947. ↩ ↩2
-
Handbook of Texas Online, Texas State Historical Association, Brenham, TX. ↩
-
The Portal to Texas History, University of North Texas Libraries, Sanborn Map Collection. ↩
